ROC curve , AUC & Recall
ROC(Receiver Operating Characteristic)curve :
In signal detection theory, a receiver operating characteristic (ROC), or simply ROC curve, is a graphical plot which illustrates the performance of a binary classifier system as its discrimination threshold is varied.
ROC curve 和 AUC curve常用来被评价一个二值分类器(binary classifier) ,输出结果只有两种类别的模型,当讯号侦测(或变数测量)的结果是一个连续值,类与类的边界必须用一个阈值(threshold) 来界定
横轴:伪阳率(FPR)False Positive Rate,在所有实际为阳性的样本中,被正确地判断为阳性的比率
纵轴:真阳率(TPR)True Positive Rate,在所有实际为阴性的样本中,被错误地判断为阳性的比率
consider 4个点和一条线:
(0,1),即FPR=0,TPR=1,FN=0,FP=0,完美的分类器
(1,0),即FPR=1,TPR=0,最糟糕的分类器
(0,0),FPR=TPR=0,FP=TP=0,该分类器预测所有样本为负样本
(1,1),预测所有的样本为正样本
ROC曲线越接近左上角,该分类器的性能越好
AUC(Area Under Curve) ,被定义为ROC curve下的面积,显然这个面积的数值不大于1,由于ROC curve一般都位于y=x的上方,所以AUC的取值范围一般在0.5和1之间
AUC=1,完美的分类器,
0.5<AUC<1,优于随机猜测
AUC=0.5,随机猜测,模型没有预测价值
AUC<0.5,比随机猜测还差
meaning:
The AUC value is equivalent to the probability that a randomly chosen positive example is ranked higher than a randomly chosen negative example.
当测试集的正负样本的分布变化的时候,ROC curve能够保持不变,在实际的数据集中常会出现类平衡(class imbalance)现象,且测试数据样本的分布也可能会随着时间变化,ROC curve基本保持原貌,而Precision-Recall则会变化很大
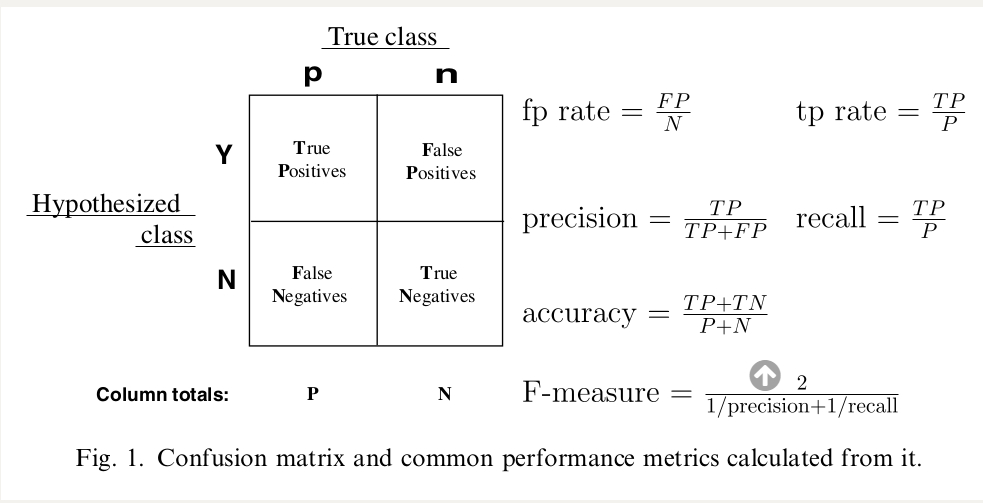
精确率 precision :预测为真的样本中有多少是真正的正样本 “预测为正的样本有多少是真正的真样本”
P=TP/(TP+FP)
召回率 recall :样本中的正例有多少被预测正确
R=TP/(TP+FN)
准确率 accuracy :
(TP+TN)/(TP+FP+TN+FN)
F1 Score :
P * R /2(P+R)